Revenue per click is the latest marketing metric buzzword, and we’re not surprised. Keep reading to see why it’s a crucial stat to measure your marketing success with.
Choosing the right KPIs to track as a marketer is key. Choose wrong and you could waste a lot of time on reports that don’t matter and a lot of budget on poorly optimised campaigns.
We found that just 23% of marketers are confident they’re tracking the right KPIs. Where is that uncertainty coming from? Is it because they’re using as many as 13 channels to share their content?
When it comes to measuring your marketing, the best revenue to look at is always going to be revenue. It’s measurable and actionable and it can help you optimise your strategy to what drives your bottom line.
One great revenue-based metric to track is revenue per click.
In this blog, we’ll delve into:
So, let’s get stuck in.
💡 Pro Tip
Focusing solely on cost per lead can be misleading. Not all leads convert. Ruler Analytics provides a more comprehensive view by tracking leads throughout their entire journey and capturing essential details, including key marketing touchpoints. This insight helps you identify which marketing efforts genuinely drive revenue, allowing you to calculate a more precise revenue per click.
Book a demo to see how Rulers measures revenue per click
Revenue per click can be defined as the average amount of revenue based on your conversion rate within a given campaign.
For example, if you run a PPC campaign and overall it generates £20 across 10 clicks then that’s a revenue per click of £4.
£20 x 20% = £4
Pretty simple, right?
Revenue per click is calculated by multiplying your goal value or revenue generation by the conversion rate.

You can calculate revenue per click as a whole, or drill down the metric by a campaign, ad or even keyword.
64% of marketers track revenue as a key marketing metric. But understanding it on a holistic level, isn’t enough.
Breaking it down by source, campaign, ad and more can help you better qualify your marketing initiatives. Plus, once you know what’s working, you’ll have the information you need to start making data-driven decisions.
Revenue is the metric that matters most. How many times have you sat in a board meeting and senior management have asked you, “how many sales does marketing bring in?”. Or, “how many sales has our paid digital advertising brought in compared to the amount spent?”
These are vital questions. But sometimes, they’re hard to answer.
Here’s why:
You’re trying paid ads, you’re getting creative on social and getting targeted on email. But, your users tend to convert offline.
What does that mean?
Well, they might call your sales team. Or, they might visit your store. How can you trace that sale back to any online interactions they might have had?
You work in a marketing team promoting high-value products or services. As such, you tend to see longer sales cycles. Leads come in, but they could take months, or even years to convert.
Related: Tips to close deals faster
How can you understand a sale that’s generated from a lead with a gap over a few months? Most tracking timeframes last 90 days meaning you won’t get to see revenue placed against your marketing, or paid adverts, even if your customer can convert online.
Those of you working in eCommerce who are rolling your eyes right now. Hold up. You’re not off scot-free either. While you might be able to track your direct revenue brought in, what about the indirect impact of ad campaigns?
Every customer follows the buyer’s journey. That’s the awareness, consideration and decision stages.
Related: How to view full customer journeys with Ruler Analytics
You might set up an ad campaign where 100 users click and interact with your page, but don’t convert.
However, 50 of them return again, via organic or direct search. Maybe they convert on this session. Or perhaps they convert three touchpoints later.
Without proper tracking, you can’t see how your marketing is helping to move customers along the buyer’s journey.
Chances are, if you’re using paid campaigns, you’re likely tracking cost per click.
It’s a good indication of the level of interaction you’re getting on your website, but it doesn’t tell you much about what value those clicks have.
You could get 1,000 clicks on an ad but only generate one sale. Therefore, cost per click doesn’t give you information on how your ad is generating revenue.
Let’s use an example.
You set live two campaigns on paid social. Both result in 5,000 clicks (unlikely but go with us!).
From this analysis, you would assume the campaigns are performing equally well.
But, from a revenue perspective, campaign one generated £300 while campaign two generated £8,000.

So, maybe something about your targeting or your message is resonating better on campaign two as you’re generating much more revenue.
Again, tracking all of your campaigns from a cost per lead perspective is essential to a good report. But, it’s not the be-all and end-all.
Let’s use another example.
You set two campaigns live.
Campaign one and two both generate 50 leads.
Again, you think that they’ve performed equally.
But in campaign two, ten of those leads didn’t fit your product. While another five never converted.
The remaining leads convert, but at a much lower revenue than in campaign one.
From a revenue perspective, campaign two drives £50,000 in revenue while campaign one drives just £3,000.

Without a clear understanding of the impact on revenue, you’re essentially marketing blind.
Now, if you work in eCommerce then of course you have a much easier time of tracking your direct online purchases.
But what if you don’t have eCommerce capability?
In Google Analytics, you can assign values to goals. This means, every time a user calls your business, or fills in a form, you can mark that as being worth £100.
Related: How to set up Google Analytics conversion tracking
However, how accurate is this?
While it’s good to get an idea of the potential income you’re generating, wouldn’t it be better to just use the real figure?
This is where marketing attribution comes in.
Marketing attribution is the best tool to use if you want to measure your campaigns and advertising by revenue.
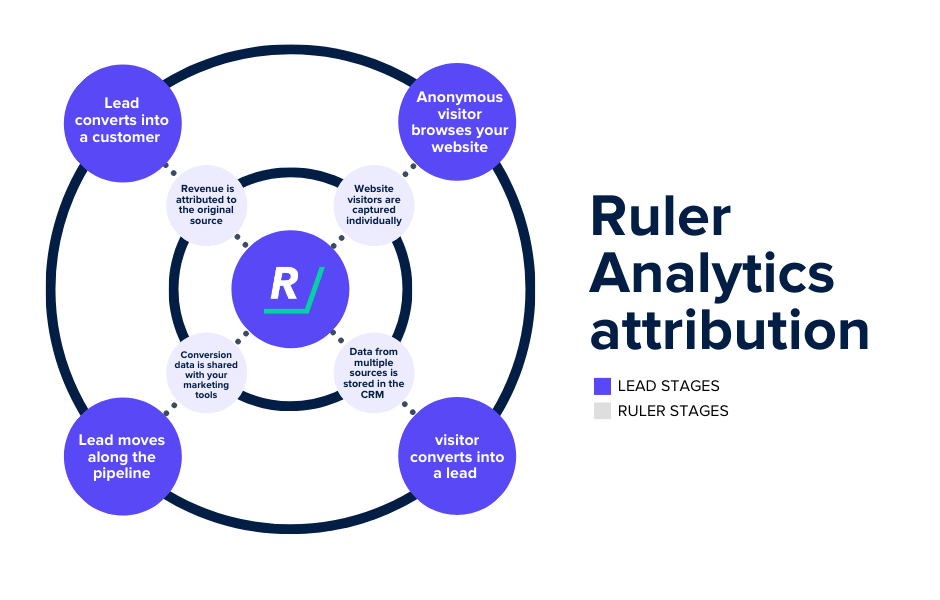
Ruler Analytics integrates with your preferred marketing apps to ensure all the data you need, is exactly where you want it.
Marketing attribution tools act as a go-between for your website and your marketing tools. They carry all of the essential data on your leads and input it to your CRM. They also harvest the revenue data inputted in your CRM and fire it in the apps that need it.
💡 Pro Tip
Read our guide to the best marketing attribution tools on the market. Or, get started with Ruler, the leading attribution tool, by booking a demo.
That means, in Google Analytics, you’ll be able to see revenue marked against your channels and your campaigns.
And in Google or Microsoft Ads, you’ll be able to attribute revenue back to your campaigns, and even keywords.
With this data, you’ll be able to:
Related: Read exactly how Ruler can attribute your closed sales back to your marketing
Say goodbye to the lack of visibility of your leads. Now, you’ll be able to see full customer journeys and use that data to find micro-conversions that are powerful at moving customers from one stage of the buyer’s journey to another.
Here’s how it works:

So, forget cost per click and start tracking your marketing with revenue per click.
Not only will you get a clear view on which channels and campaigns are working and which are draining your time and budget; you’ll also shift internal conversations from marketing being seen as an expensive and ineffective line on the budget to focusing on how marketing is fuelling growth.
Book a demo to get started with lead tracking and take the guesswork out of your reporting.
