Compare different attribution models and see which marketing channels are truly pulling their weight.
Remember the days when a customer journey resembled a straight line: see an ad, visit a website, buy something?
Those days are long gone.
Today’s savvy consumers weave a web of touchpoints before converting – social media posts, blog articles, review sites – the list goes on.
Traditional analytics tools, stuck in the single-touch era, often give all the credit to the last touch, the one that “closed the conversion.”
But this approach hangs the rest of the journey out to dry, painting an incomplete picture. Bottom of the funnel channels get all the glory, while valuable top of the funnel efforts stay hidden and undervalued.
Marketers used to have some solace in Google’s attribution comparison feature, allowing them to see how different models like first-touch, linear and position-based, etc. played out with their data.
However, during the switch to GA4, Google retired these models, leaving only last-click and data-driven attribution.
Despite these challenges, there is hope. Ruler has launched a game-changing feature: multi-touch attribution comparison.
It shows how different marketing touchpoints contribute to conversions, revenue, ROI, etc. and even includes all the familiar attribution models you used to rely on in Google Ads and Analytics.
If you’re not familiar with Ruler, it’s a marketing measurement and attribution platform that tracks visitors across all their interactions with your company, from website visits to phone calls, allowing you to see exactly which campaigns, ads, and keywords are generating leads and revenue.
Additionally, it uses advanced techniques like machine learning to analyse the impact of impressions on revenue and uses marketing mix modelling to predict the future effectiveness of your marketing spend.
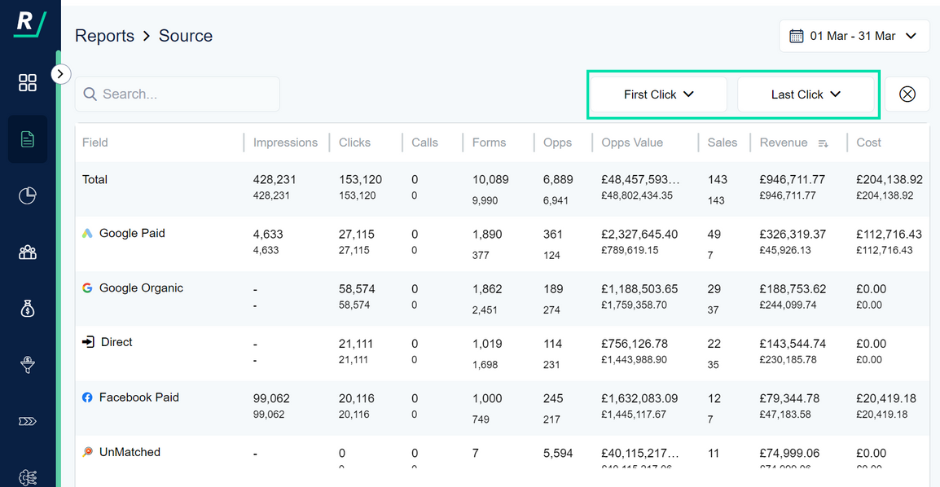
Ruler’s Attribution Model Comparison feature helps you understand how different marketing channels contribute to conversions and pipeline. It lets you see which channels are truly driving results, and not just getting the final click.

Users can easily switch between different models directly within their reports.
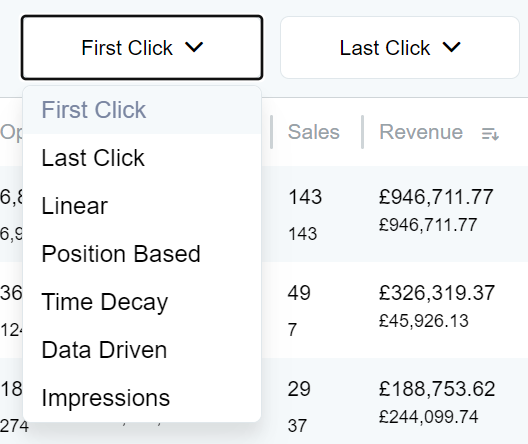
Simply navigate to the desired report (e.g., Source Report, Keyword Report) and select the models you want to compare from the available drop-down.

Ruler allows users to select up to two attribution models to compare simultaneously. It offers a comprehensive selection, including all the multi-touch models previously available in Google Ads and Analytics, such as:
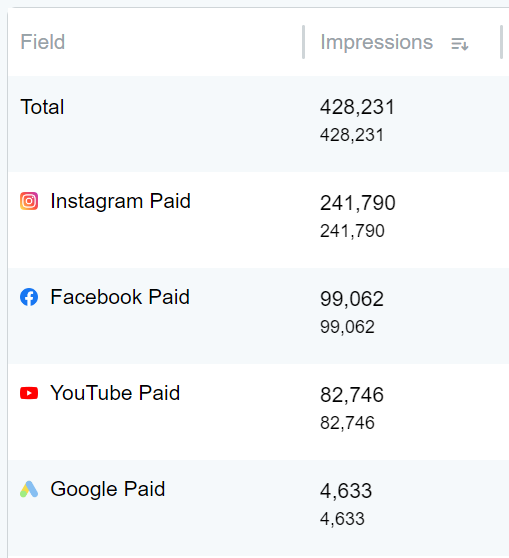
Ruler even has a unique model for impressions. It uses advanced machine learning to reveal the hidden influence of ad views, even if they don’t result in a click, and connects them to revenue outcomes. We have a complete guide on impression attribution, which explains the model in more detail.

Once the models are selected, Ruler Analytics compares them side by side. Each model distributes credit differently across touchpoints based on its unique algorithm.
Armed with insights from the attribution model comparison, users can gain deeper insights into the customer journey and make data-driven decisions to enhance their marketing effectiveness.
We’ve got the technical side of Ruler’s multi-touch comparison down, but what benefits can it offer? Let’s take a deeper dive.
Marketers have traditionally relied on last-click attribution, which credits the final touchpoint for a conversion e.g. form fill, purchase.
It’s popular because it’s simple to track and works well for fast, inexpensive purchases driven by bottom-of-the-funnel campaigns, including Google branded search and retargeting.
While this approach offers a clear endpoint, it fails to capture the intricate dance of influences that often lead to a conversion.
Ruler’s multi-touch comparison feature allows you to move beyond the limitations of last-click attribution. By leveraging the power of multi-touch data, you can gain a holistic understanding of how various touchpoints contribute towards conversions.
Consider this example:
A user sees a compelling ad for your product on LinkedIn. Intrigued, they visit your website to learn more about the brand.
After browsing your website and familiarising themselves with your offerings, the user sees a captivating carousel ad for your product on Facebook, highlighting attractive promotions. They click on the ad but ultimately don’t convert at that time.
Later, still considering the product, the user decides to search online. They type the product name into Google and see a Google Ads result, prompting them to revisit your website. This time, the user completes the purchase.
Ruler’s comparison feature allows you to visualise the influence of these different marketing channels—LinkedIn ads, Facebook ads, and Google Ads—on a customer’s journey to conversion.
With last-click attribution, you might focus solely on Google Ads since it resulted in the final click. However, using a first-click model would highlight LinkedIn’s role in generating initial interest.
But Facebook’s contribution shouldn’t be overlooked either. A linear attribution model would acknowledge all three touchpoints by distributing credit evenly.
By comparing different attribution models you move beyond a one-dimensional view, give credit where it’s earned and optimise your marketing efforts for better results.
One of the most significant challenges with many marketing analytics platforms, including Google Analytics 4, is their limited data retention period. GA4, for instance, typically offers a lookback window of only 90 days.
This poses a problem for businesses with lengthy sales cycles, where the time from initial touchpoint to conversion can extend well beyond this timeframe.
Valuable insights into customer behaviour and touchpoint attribution are lost, hindering effective marketing campaign optimisation.
Ruler breaks free from this constraint by offering an unlimited lookback window.
You can access and analyse your data for any timeframe, regardless of how long it took for a conversion to occur.
This is particularly beneficial for businesses in industries with extended sales cycles, such as B2B enterprises or those selling high-value products or services.
At best, Google Analytics 4 allows for comparisons of key events and revenue (specific to e-commerce) using just two models: last-click and data-driven.
Ruler’s multi-touch comparison feature enables you to analyse a wider range of metrics critical to leadership teams, including clicks, form submissions, call recordings, revenue generated, return on ad spend, and cost per acquisition.
Armed with this data, you can move beyond click and conversion based reports and present a data-driven case for increased marketing budget.
By showcasing the impact your efforts have on revenue, ROAS, and CPA, you can gain leadership buy-in and secure the resources needed to fuel further growth.
With a range of attribution models to choose from, unlimited lookback windows, and the ability to compare metrics like revenue and marketing spend, Ruler empowers you to move beyond single-touch attribution, allowing you to demonstrate marketing impact to leadership and maximise the value of your budget.
Book a demo and see for yourself how Ruler can transform your marketing measurement.
