
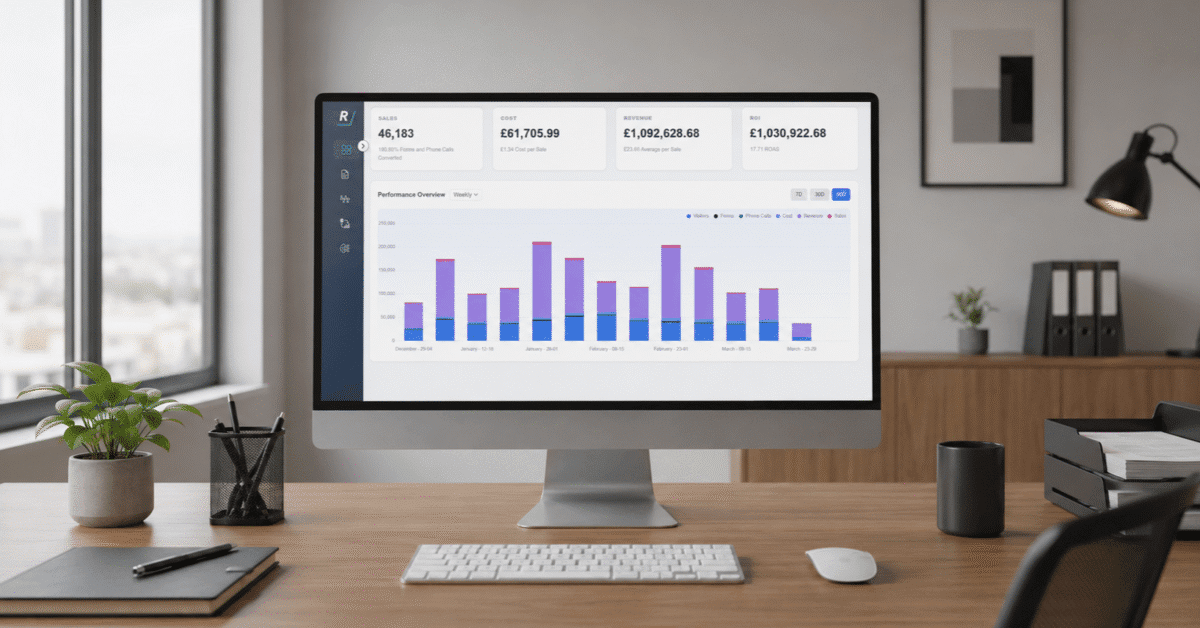
How we helped an eCommerce brand in the healthcare sector unify digital advertising, retail media and TV measurement into a single, end-to-end platform view.
When you’re selling a health product across ecommerce, retail, and TV at the same time, understanding what’s actually driving sales becomes one of the harder problems in the measurement. Our client, a fast-growing health consumer brand, was running paid media across Google, Meta, connected TV, Amazon, Walmart and QVC simultaneously.
The business was growing, but the picture of what was working, and what wasn’t, was getting harder to read.
The measurement challenge
Running paid media across this many channels creates a specific kind of measurement problem. Each platform is reporting its own version of the truth, and those versions rarely agree with each other or with what’s happening in the real world.
For our client, the clearest example of this was Google. Last-click attribution meant Google was claiming credit for a huge portion of conversions, including a lot of sales that had been influenced upstream by a TV ad someone saw two weeks ago, or a display ad they scrolled past before they even knew they needed.
Upper-funnel activity was effectively invisible in the numbers, which meant the channels doing the hard work of building awareness looked like they weren’t pulling their weight.
This wasn’t just a reporting annoyance, it had real consequences for how budget decisions got made.
At the same time, our client had something most DTC brands don’t have to contend with. A significant offline retail footprint across Amazon, Walmart, Costco and QVC.
Sales through these channels were happening, but they were sitting in a completely separate data silo from anything digital.
There was no clear way to understand how online advertising was contributing to those offline purchases, or how the halo effect of brand activity was flowing through to retail. The two worlds just weren’t aligned with each other.
Throw in the complexity of the category, longer consideration cycles, a lot of research before purchase, customers who might see an ad on TV and then buy six weeks later on Amazon, and you’ve got a measurement challenge that goes well beyond what standard attribution tools are designed to handle.
Ruler’s solution
Ruler provided a Marketing Mix Model covering the full span of spend and revenue data from the last 2 years. More importantly, the model brought online and offline together in a single framework.
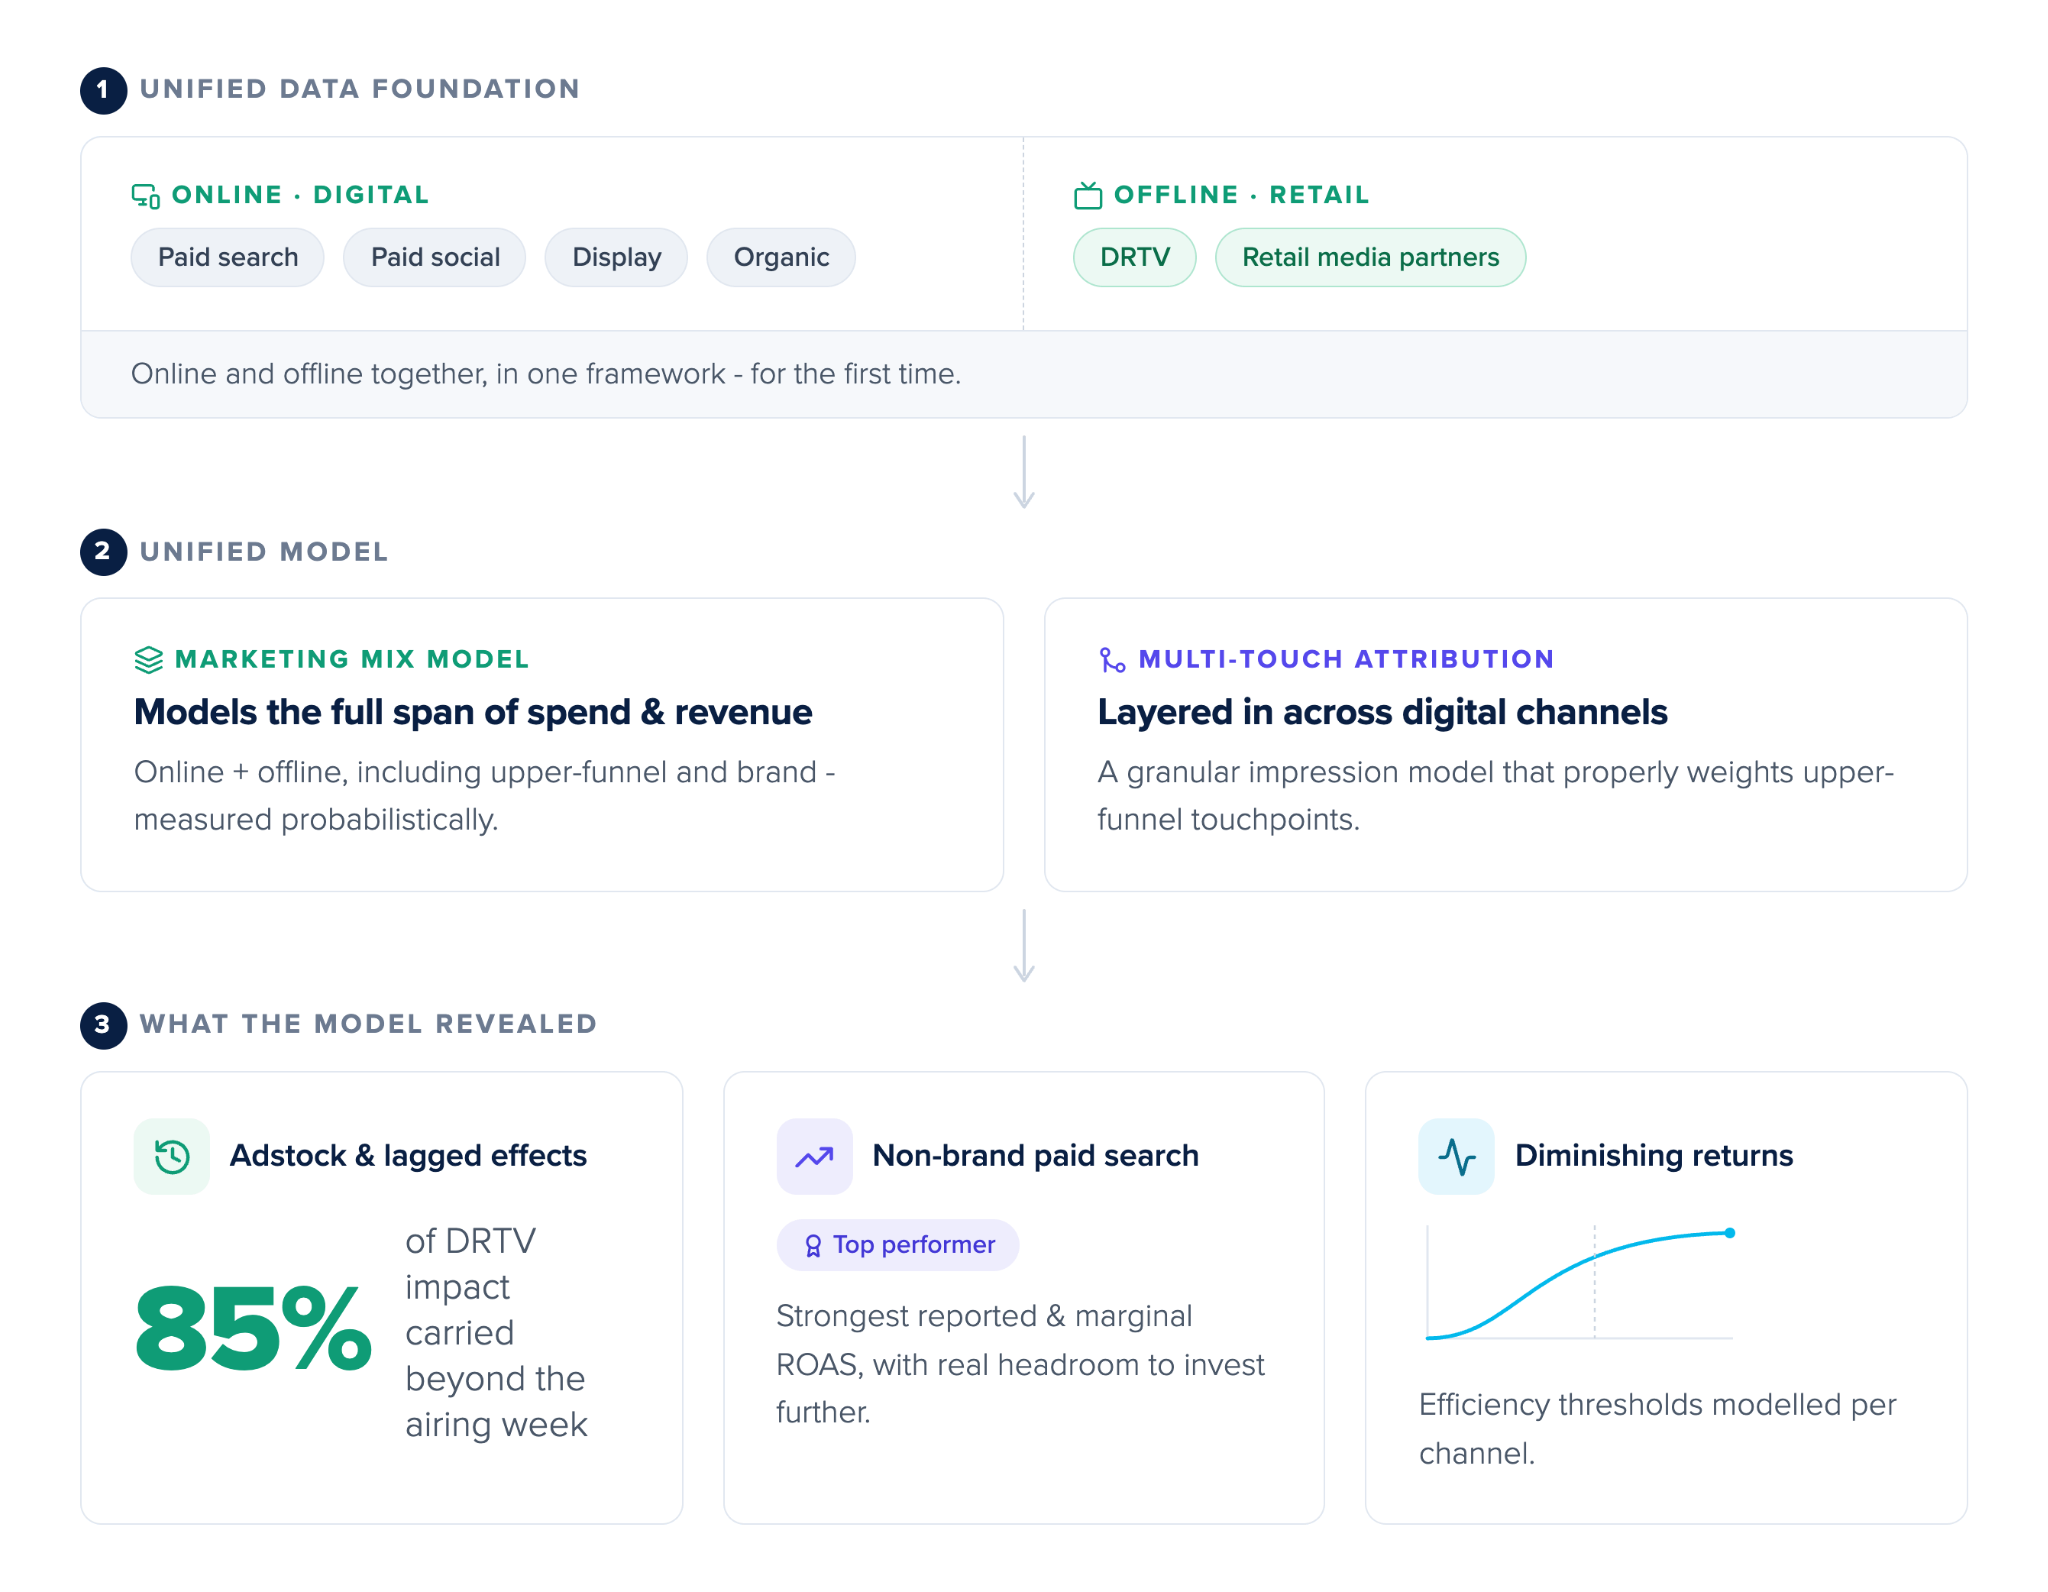
Digital channels sat alongside retail data from their wider retail media partners. For the first time, the team could see everything in context.
One of the most valuable outputs was the adstock and lagged effects analysis. This is the kind of thing that traditional attribution can’t tell you. Not just what converted, but when and how long an ad’s influence actually lasts.
For their DRTV activity, the model found that 85% of the impact was carried forward beyond the week the ad aired, meaning the channel was doing far more work than any click-based model would ever show.
Alongside the MMM, Ruler layered in multi-touch attribution data across digital channels to build a more granular impression model that properly weighted upper-funnel touchpoints.
Non-brand paid search emerged as the strongest performer when looking at both reported and marginal ROAS, with real headroom identified for additional spend. The kind of finding that gives budget conversations a much more solid foundation.
Diminishing returns curves were modelled for each channel, so the team could see not just what was working but at what point additional spend would start to lose efficiency. That’s the kind of clarity that makes forecasting and budget scenarios genuinely useful rather than theoretical.
As a next step, incrementality testing was run via Microsoft Ads holdout audiences, with Ruler supporting the measurement side to help build the evidence base for ongoing decisions.
The results
A few things stood out once the model was in place:
Across the full period, the model attributed $103m in total revenue, with paid media channels accounting for just over half of that at 53%. That alone gave the team a much clearer baseline for understanding what their marketing was actually contributing to the business.
Non-brand paid search showed the strongest ROAS of any channel, not just on paper, but on marginal spend too. That means there’s room to invest more without hitting the point of diminishing returns quickly.
Amazon, Walmart and QVC were already driving sales, but with no connection to digital spend, the team had no way to quantify how much their online advertising was contributing to those purchases. The model changed that. For the first time, they could see how brand and performance activity was flowing through to retail revenue, not just their own site, and use that to make smarter decisions about where to allocate budget across the full channel mix.
You can’t make a case for TV spend in a budget meeting when you can’t show what it’s doing, but now they could. TV as a whole, combining PITV and DRTV, accounted for 8% of total modelled revenue, a contribution that would have been completely invisible in standard platform reporting.
The combination of online and offline data gave the team a clearer view of the halo effect, how digital and brand activity was flowing through to retail sales, not just their own site. That joined-up picture is exactly what they needed to make smarter decisions about where to push and where to pull back.
Ready to connect your channel measurement?
The gap between how measurement tools report performance and what’s actually happening in the business. That gap is manageable when you’re running a small, simple channel mix. It becomes a real problem when you’re running TV, paid search, retail media, and ecommerce simultaneously and trying to make budget decisions that touch all of them
MMM doesn’t replace all the other tools. It sits alongside them, and it gives you a layer of truth that neither platform reporting nor last-click attribution can provide on their own.
For this team, it meant finally being able to have a different kind of conversation about where their marketing budget should go. And that’s usually where the interesting decisions get made.
If you’re making budget decisions with an incomplete picture, we can help. Book a demo to see how Ruler brings it all together.
Book a demo Learn more